
Costs of transportation infrastructure can be divided into 2 parts: 1) capital costs to build it, and 2) operations and maintenance, O&M costs to maintain it.
Capital Costs to Build Various Forms of Transit
Transportation Options Through a PRT Lens offers an introduction to various transit factors. Page 9 of the document presents the following cost estimates for various transportation technologies. All are compared using a corridor model with travel going both ways (bi-directional). While the specific costs and estimates will vary, each mode generally maintains its cost-position relative to the others.
| Transportation Technology | Bi-Directional Cost Range |
|---|---|
| Bus Rapid Transit (BRT) – when re-purposing existing roadway | $4-9M/mile |
| Freeway/Expressway Lanes – at ground level (no land acquisition) | $10-20M/mile |
| Personal Rapid Transit (PRT) – elevated | $10-100M/mile |
| Automated People Mover (APM) – at ground level | $30-50M/mile |
| Light Rail Transit (LRT) – at ground level | $60M/mile |
| Bay Area Rapid Transit (BART) – at ground level | $130-230M/mile |
| Pedestrian Over Crossing (POC) – elevated | $150M/mile |
PRT costs already compare favorably with APM, LRT and BART. After adding in land-acquisition costs to BRT and Freeway Lanes, PRT will likely be less expensive than those options also. Elevated versions of APM, LRT and BART would cost twice as much as ground-level corridors. Undergrounding often costs 3X the cost of at-grade versions. In the case of the BART Burrow (BART Extension Phase 2) the 2020 estimate is $1000M/mile ($6B for 6 miles), or 4X the at-grade cost of BART Extension Phase 1 ($2.3B for 10 miles). At $30M/mile for PRT technology, only 3% of BART’s cost would be needed to provide similar service to downtown San Jose.
PRT Increases Ridership
When considering the financial cost of PRT infrastructure, one must also consider non-financial benefits such as the effect upon public transit ridership generally and the actual service provided to users. In other words, service levels of a transit system can be observed through both cooperative and competitive filters, i.e. synergy or increased ridership of the network of transit systems, and the actual advantages of PRT compared with other options.
Less Infrastructure Stuff = Less Cost
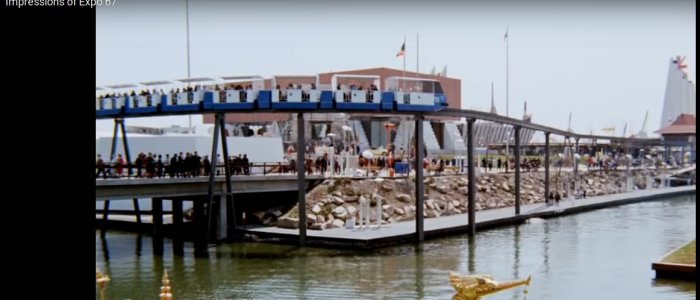
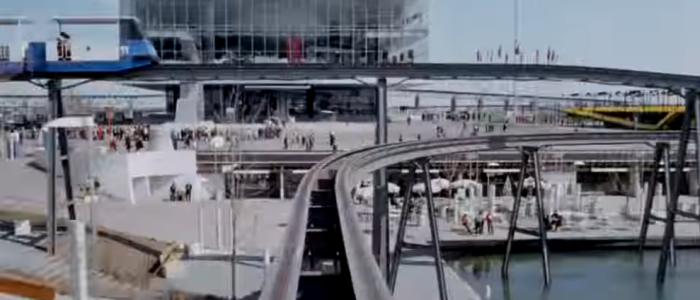
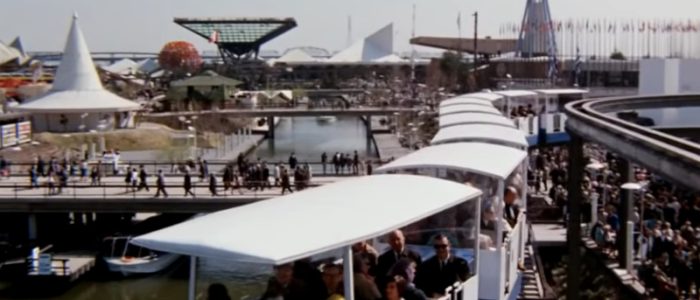
Visually, PRT-scaled transit is far smaller than other forms. These images of the monorail at the 1967 World’s Fair in Montreal show the relative size of the monorail along with the tight turning radii and flexible routing of such small-scaled system. Due to size of the vehicles (12 passengers rather than 4), the monorail is physically bigger than the LoopWorks’ guideway, and it requires supports that are both larger and more frequent. (These screenshots come from an 8-minute film about the Fair.)
Comparing Transit Guideway/Track Sizes
The below image shows the relative sizes of Disney Monorail guideway, elevated LRT railbed, and PRT guideway. The small print shows that the Disney Monorail uses 5,800 cu. yards of concrete and 1200 tons of steel per mile, while the elevated LRT railbed uses 28,000 cu. yards of concrete and 2900 tons of steel per mile. The elevated LRT railbed built through Milpitas cost about $120M/mile. As you can see, TriTrack (a minimalist type of PRT) uses far less concrete and steel, and therefore costs far less to build. The LoopWorks guideway will be about twice the size of TriTrack guideway.

The below image comes from ATRA’s document Infrastructure Cost Comparisons for PRT and APM, which compares infrastructure for an ULTra PRT guideway, the Las Vegas monorail, the Sydney monorail, and the Kuala Lumpur LRT. While ULTra PRT guideway is 3 times the size and weight of LoopWorks PRT guideway, both are much smaller than an equivalent footbridge which must accommodate pedestrian crowd loads, normally required to be around 500kg/m2 — substantially higher than the 200kg/m2 load of a continuous string of PRT vehicles.

This graph shows relative costs of 5 configurations of guideway. Type 2, supported, is the type used by LoopWorks and generally costs the least to build. As you can see, spans of about 30 meters (90 feet) are most cost-effective.

The below image shows the size of the SkyTran PRT guideway relative to cars and buildings.

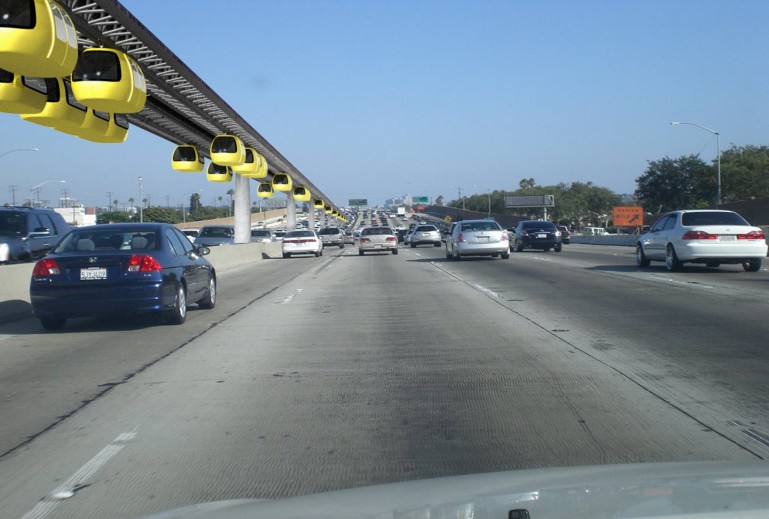
The below image shows the J-Pods PRT footprint compared to a freeway.
Operations and Maintenance Costs
Read about O&M costs.